Rockbuster Stealth LLC is a movie rental business which has failed to innovate and adapt with the times. They werere still renting videos online!
Fortunately for them, they realised thier error and decided to make a change to compete with streaming services. But before they launched, they wanted to use their historical data (in a relational database) to draw insights to develop a focused strategy.
Rockbuster is a fictional business, created for my Career Foundry course, but the queries used are real, and the insights, well, insightful.
Tools:
- Excel (queries to CSV for visuals in Tableau)
- PostgreSQL (Queries, Subqueries, CTEs, Joins)
- Tableau Public for visualizations
Data:
- Relational Database
- 2 Fact tables & 13 Dimension tables
Step 1: Getting to know the Data
I began by creating a diagram of the datatables, which exhibited a snowflake pattern. I also created a data dictionary so that I would have a quick reference for the more complicated joins later on.
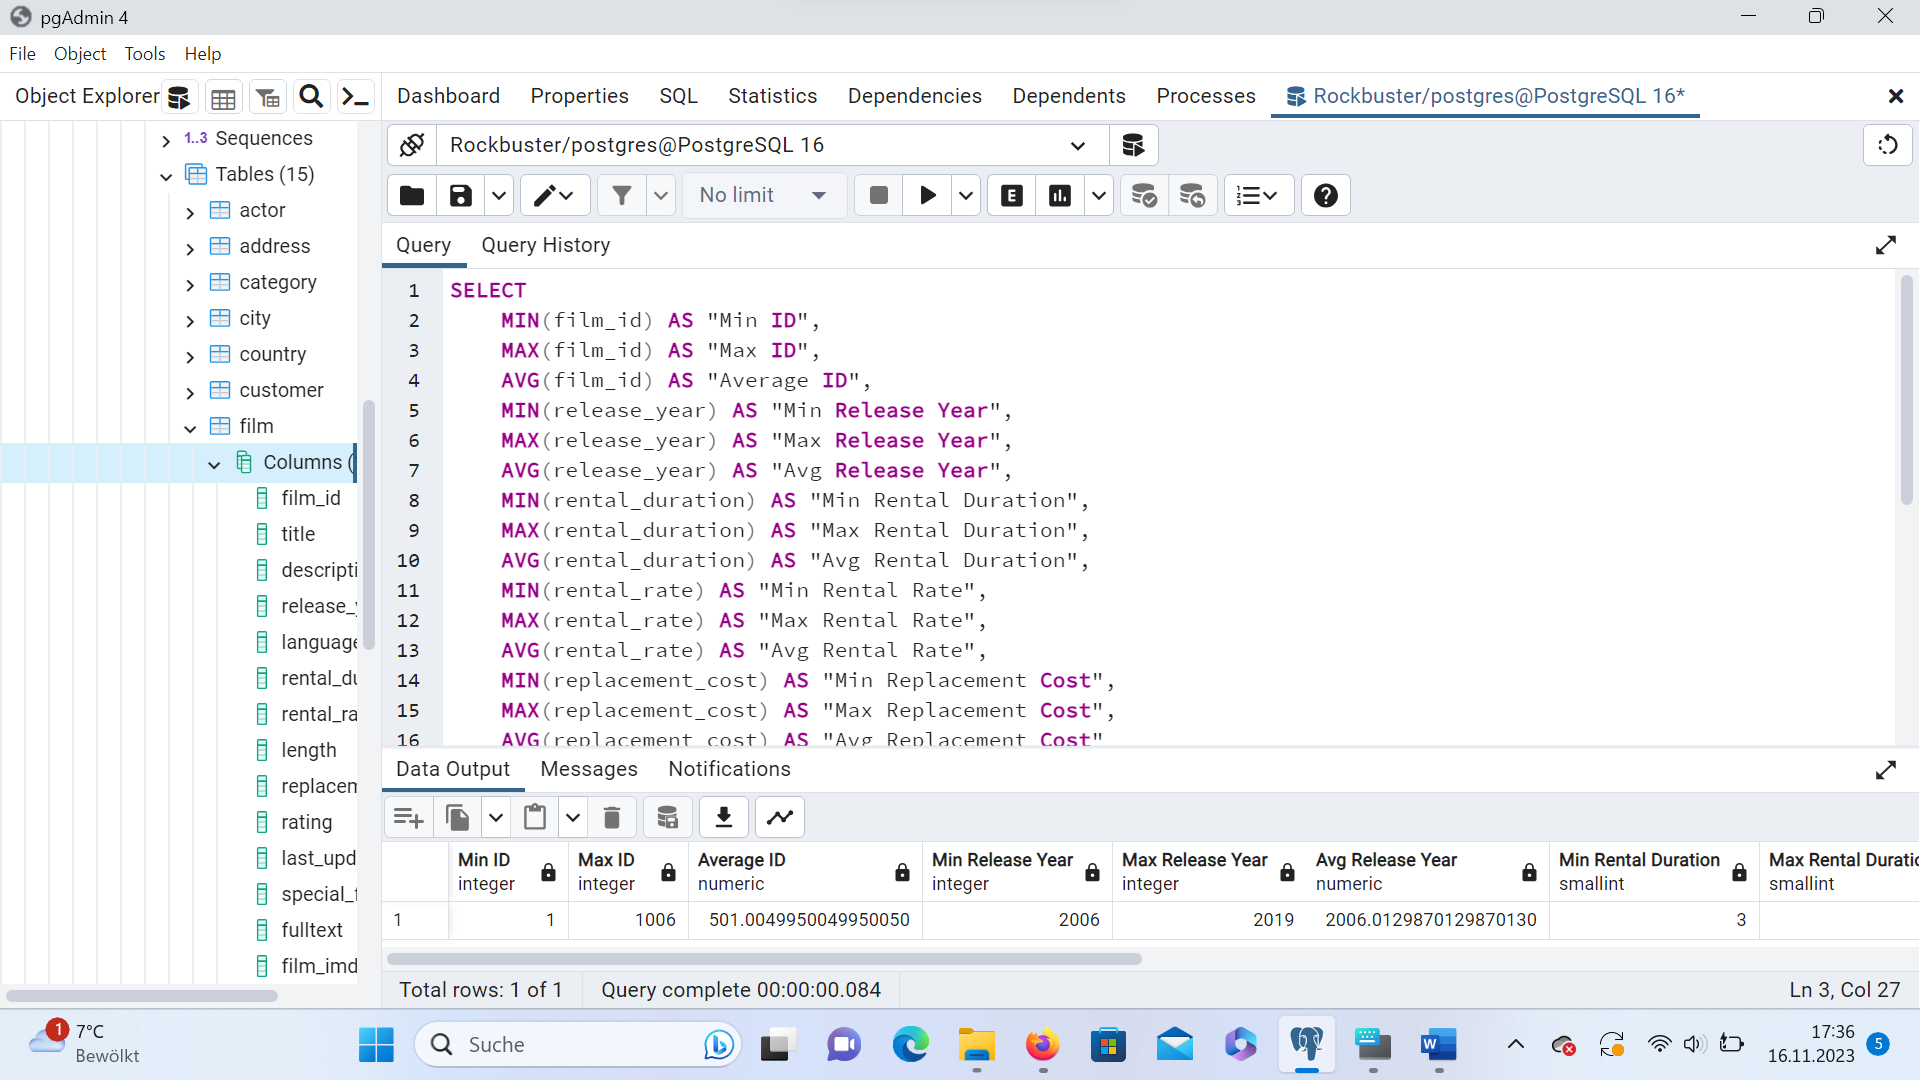
I examined the structure of the tables in the database as well as the type of data contained within them
Thereafter, I searched for any duplicate records or missing values in the customer and film tables, because these would have skewed the results. I confirmed that there were neither.
Finally I queried to obtain basic descriptive for the numerical columns in the film table. These include MInimum, Maximum and Averages for the respective columns.
Step 2: Defining Questions
To give direction to the project, I began by defining questions which I would like to answer.
In search of answers to questions like:
- What are the average/ maximum movie rental rates?
- What are the average movie rental durations?
- Which countries contribute most to revenue?
- Which genres contribute the most to revenue?
- Where do we find our most loyal customers by spend?
Step 3: Results
For a closer look at some of the queries I used, you can download the project folder. The button for which is at the bottom of this case study. What follows is an overview of results.
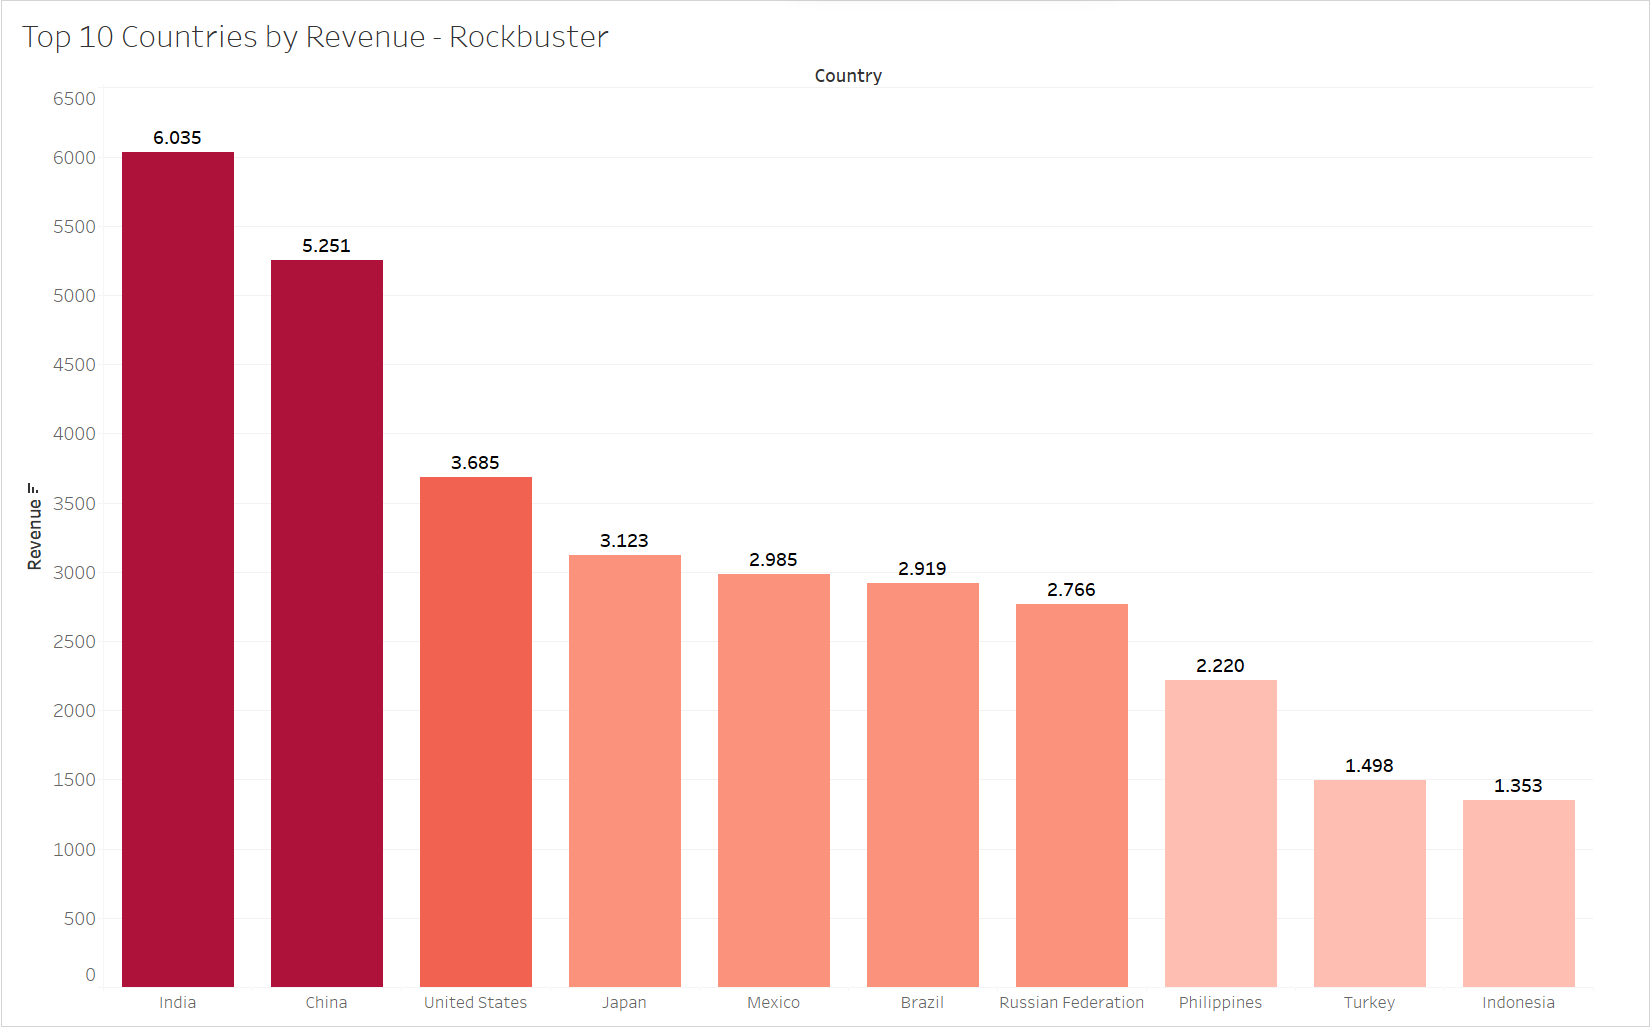
The countries generating the most revenue for Rockbuster are India, China and USA in that order. This is relevant when management makes future considerations for which geographic markets to target and what prices to charge for their service.
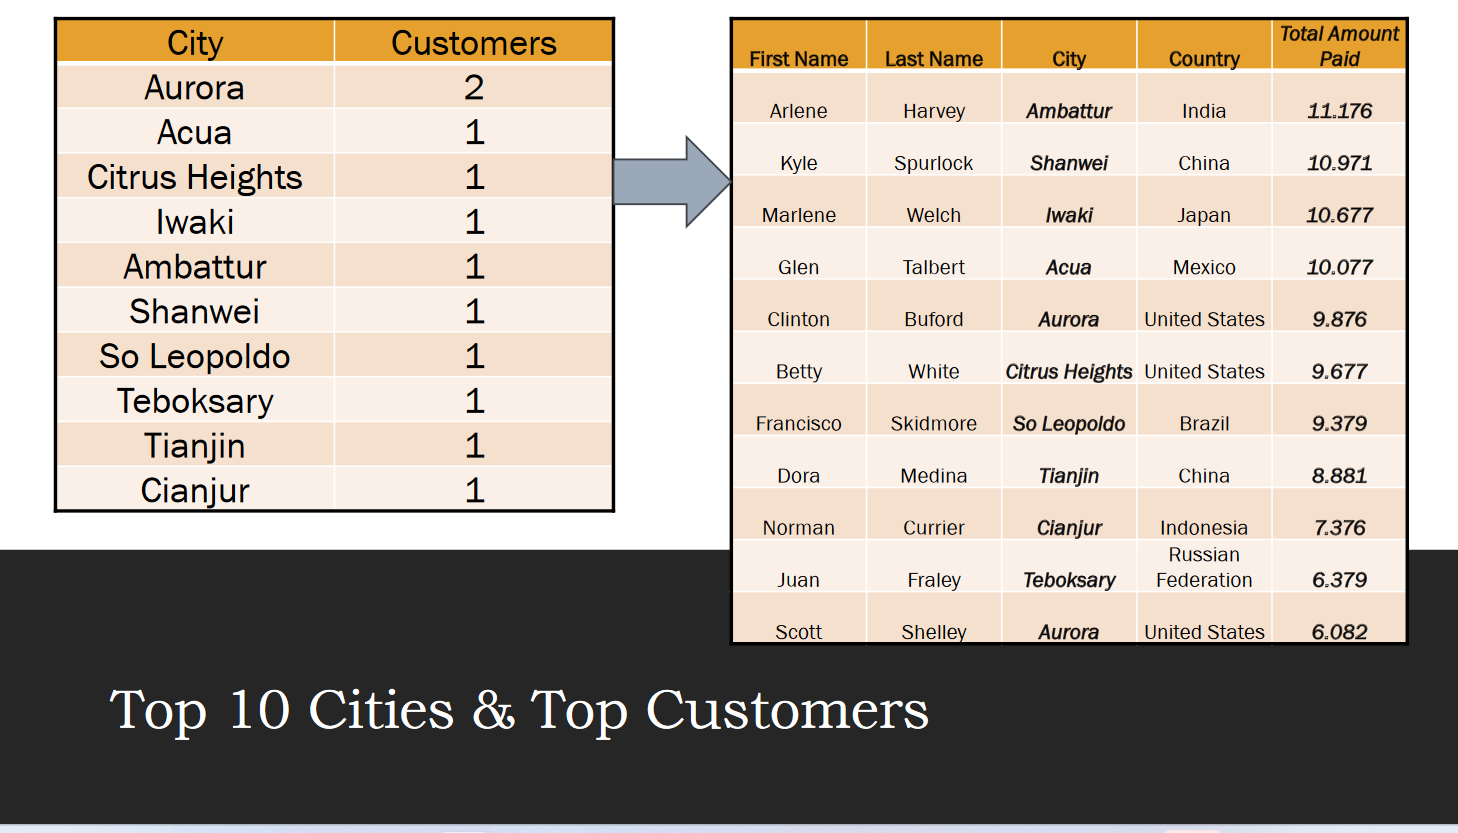
Next, I looked for the top cities, in the top countries, as well as the top customers. This required the use of a subquery.
So now that I new which were the top countries, and the respective top cities and customers in those countries, I wanted know which genres generated the highest revenue. Also of interest were the ratings which were most popular.
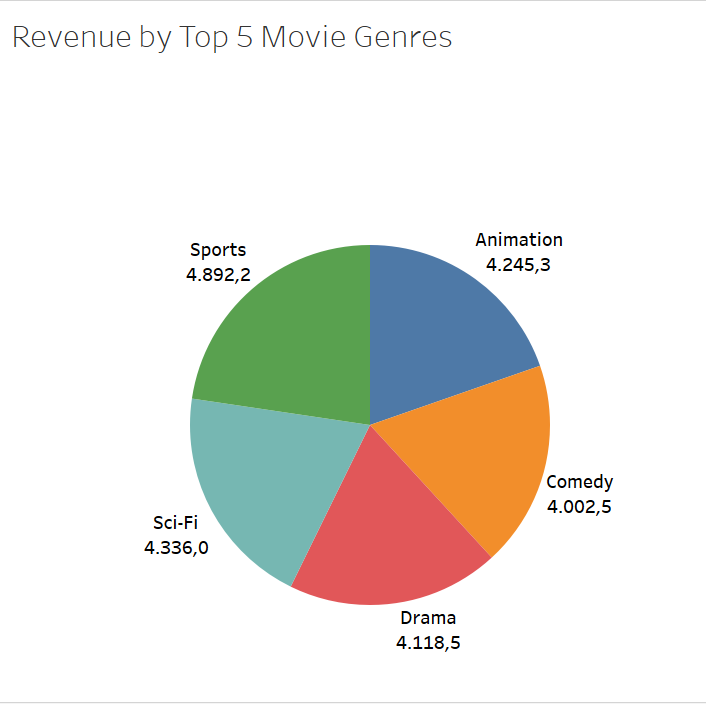 The different movie genres generate about the same revenue
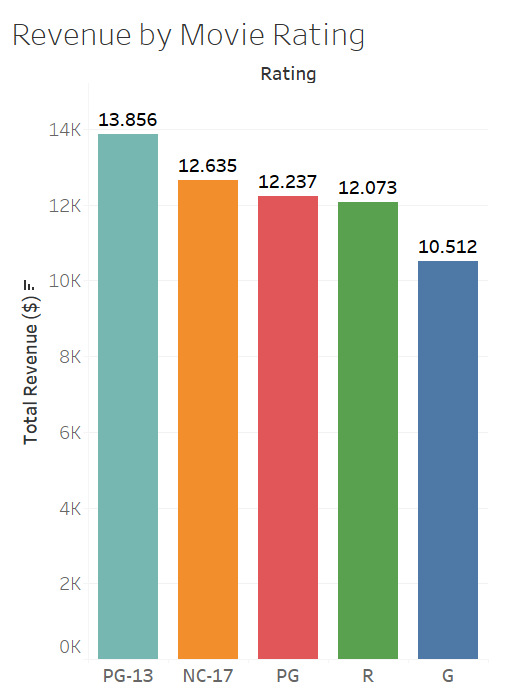 We see that PG-13 movies generate the most and G, the least.
We can see that with the help of such a chart, management can make an informed decision when deciding on which movies to spend more on, when acquiring movie inventory for their new streaming service.
Step 4: Recommendations
Based on the results of the analysis I could then answer the questions which I had posed at the beginning of this project. I created a Power Point which communicated these results in a user-friendly way.
Recommendations and Way Forward:
- Focus on growing customer bases in the top 10 countries and cities.
- Expand our movie selection in the most popular genres and ratings.
- Update our selection of movies to include latest movies.
- Further temporal anylsis could be done to investigate seasonality of movie rental.
- Collect data on the ages of our customers, to investigate ages of our target market.
Step 5: Reflections
This project was a lot of fun. One of my favourite aspects was the use of joins, CTEs and subqueries. Their importance becomes immediately obvious when attempting to answer specific questions.
Download Project FolderPlaceholder text by Mnguni Zulu. Photograph by Mnguni Zulu.