Life expectancy is one of the most important and interesting measurements of human welfare. Although a long life does not guarantee a happy one, it does seem to be important to most people.
There are so many variables which may or may not influence life expectancy, and the objective of this self-chosen project was to look at life expectancy in some 119 countries as well as 16 variables and their possible relationship with life expectancy.
Understanding what influences life expectancy, or at least the correlation between certain variables and life expectancy would be extremely useful for both internal and external development agencies.
Tools:
- Python
- Jupyter Notebooks
- Libraries : Pandas, NumPy, Matplotlib, Sklearn Clustering
Data:
- >2,000 Rows & 17 variables
- 119 countries
- open source data
Step 1: Initial Data Exploration
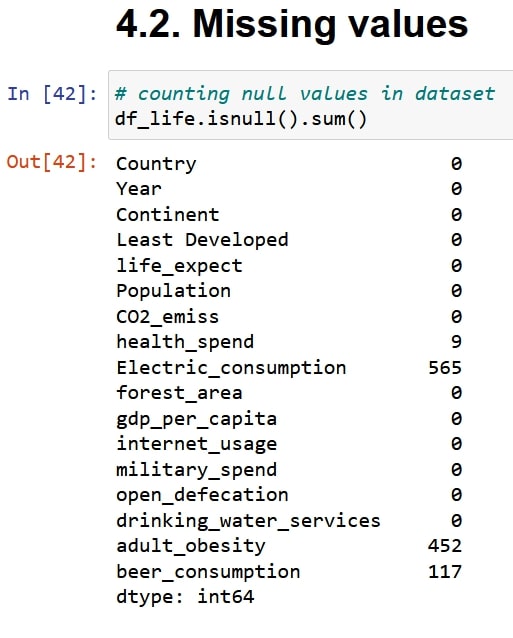
I also confirmed that were no duplicate rows in the dataset or mixed type values in the columns, which might skew the results of the analysis.
Step 2: Exploring Correlations
Now the data was explored for any interesting relationships between the 13 numerical variables. First a pair plot and heatmap were used to visualise the correlation across all the numeric variables, ranging from internet usage to the practice of open defecation.
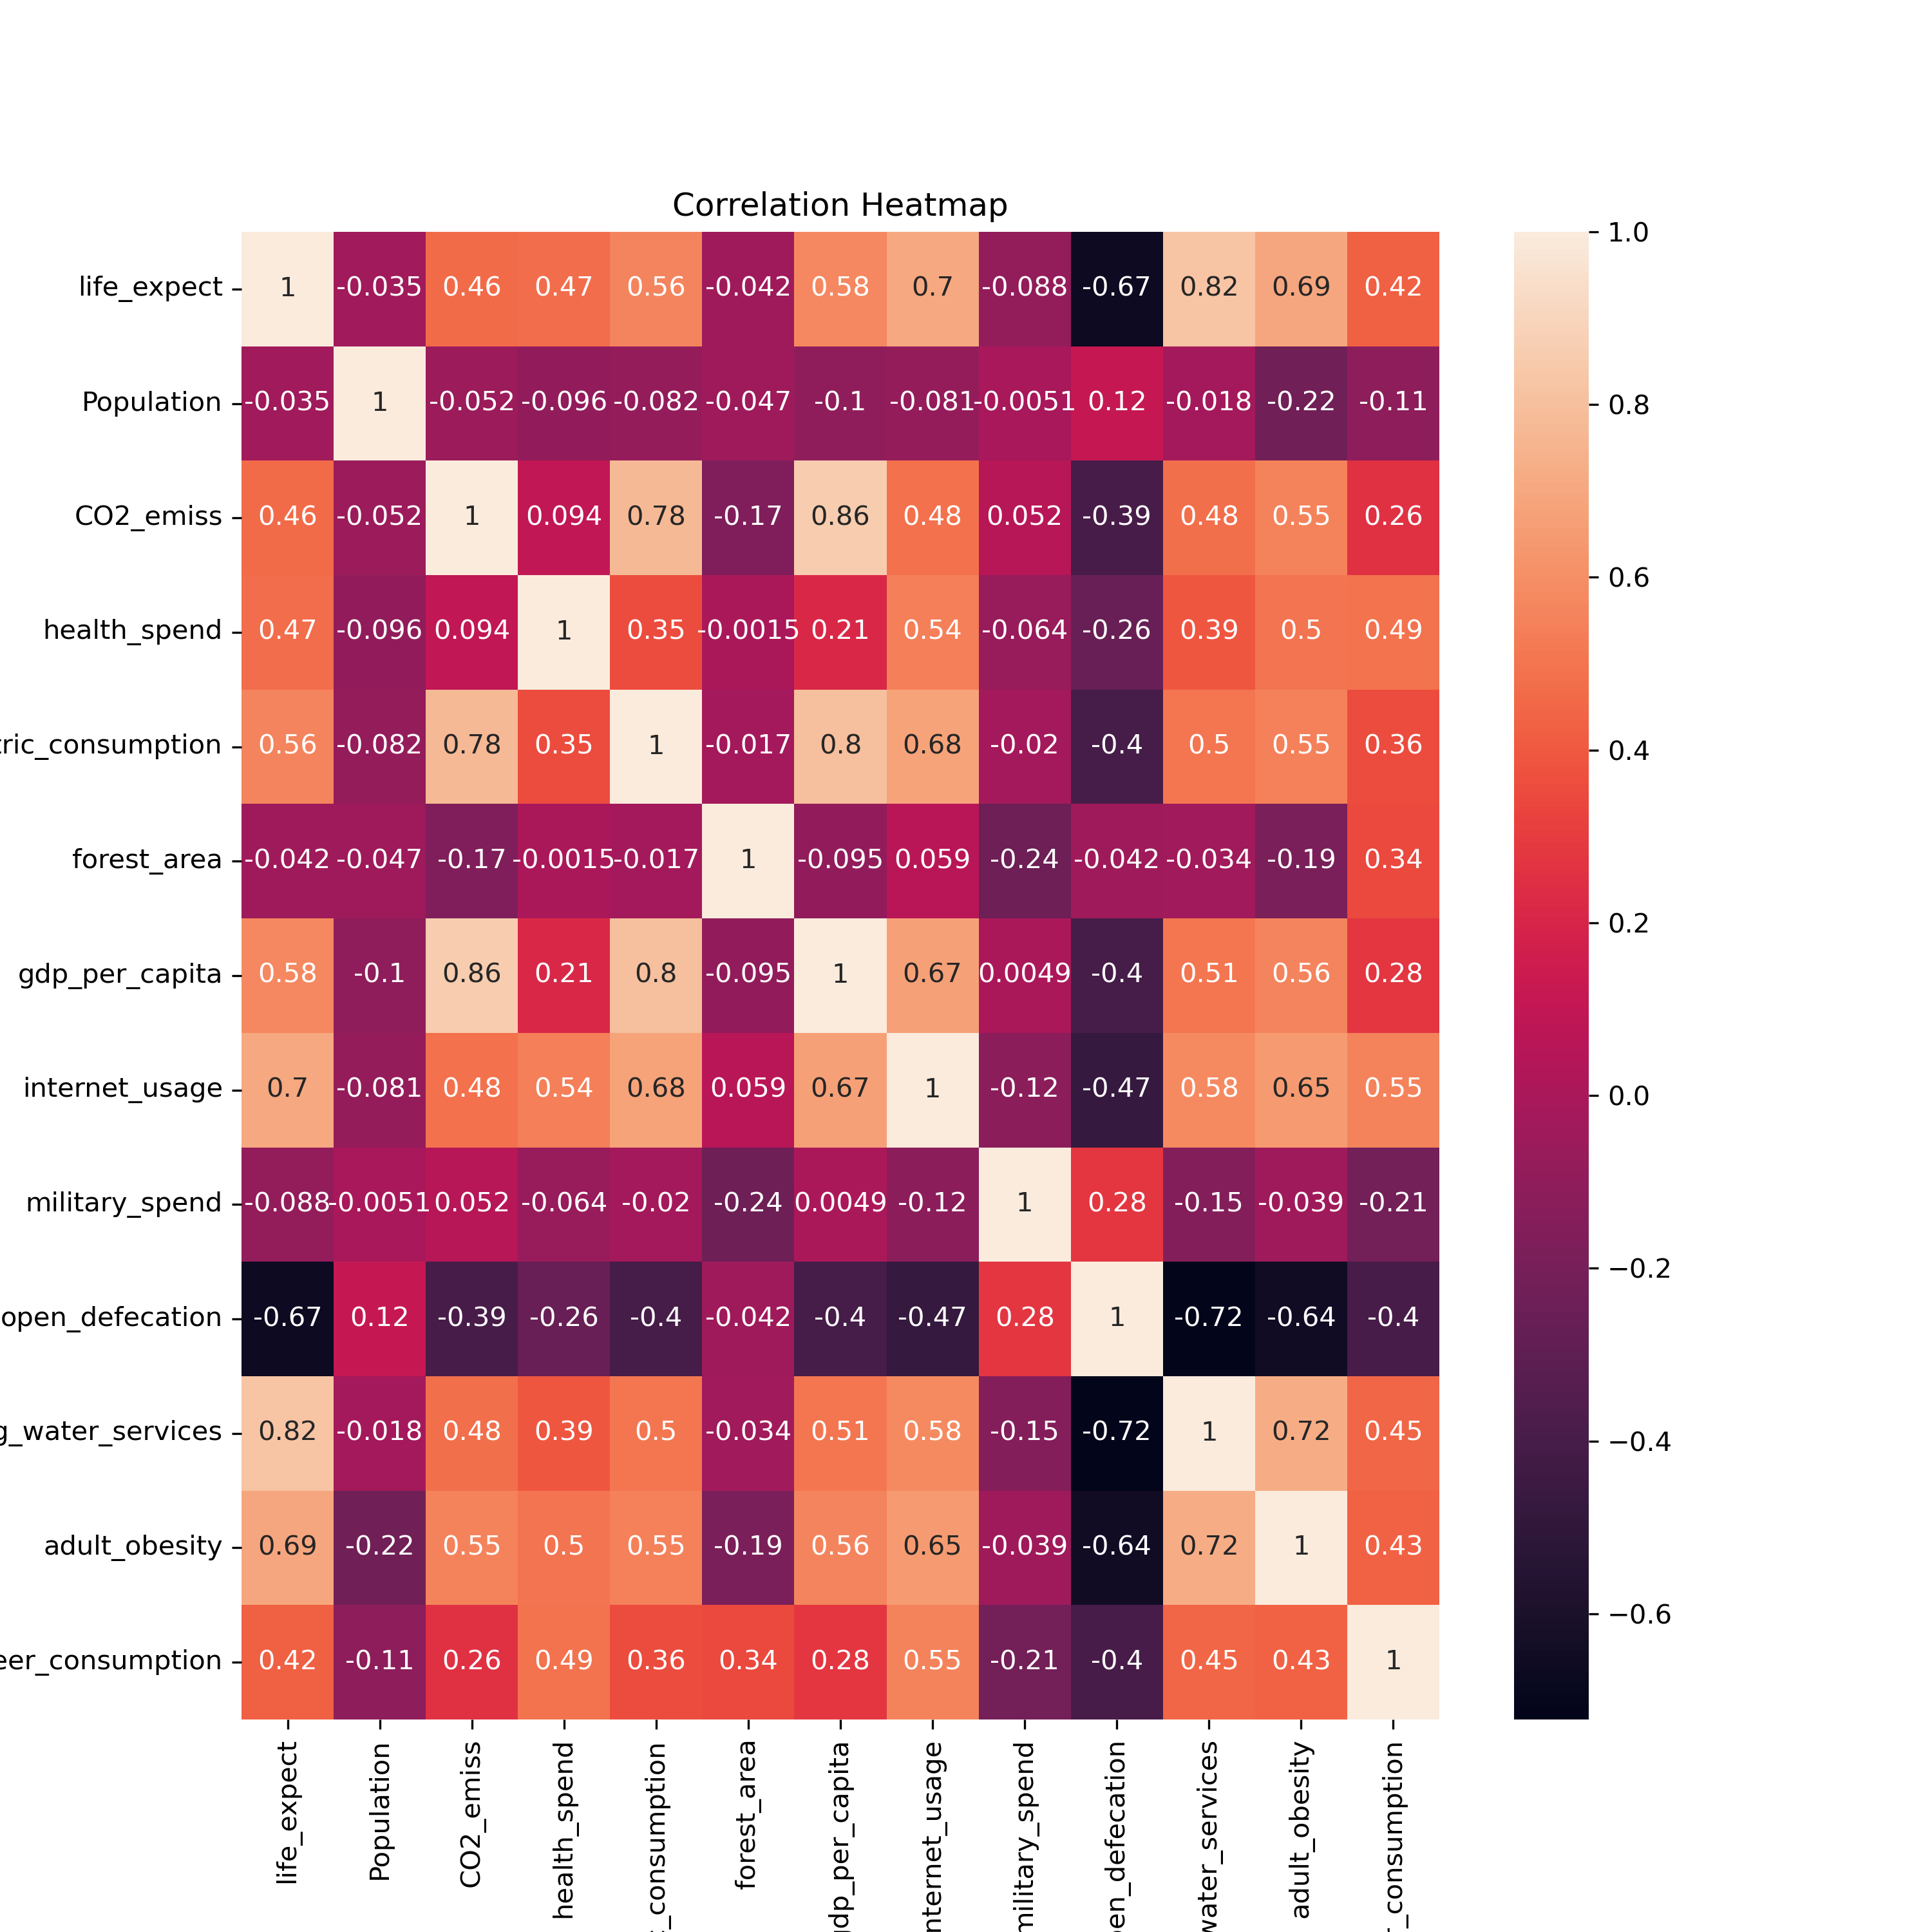
Internet usage seemed like an interesting variable to me, and so I made this the focus of my hypothesis testing and further statistical analysis.
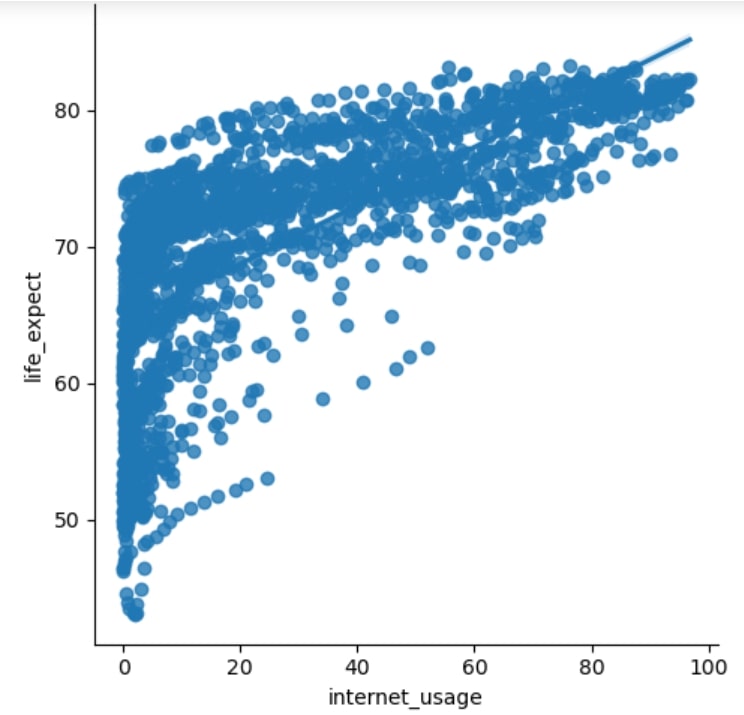
Step 3: Linear Regression
“Greater internet usage within a country leads to higher life expectancies”.
This was the hypothesis I set out to test using a simple regression. I used test and training subsets of data to determine whether one could use internet usage as a predictor of life expectancy.
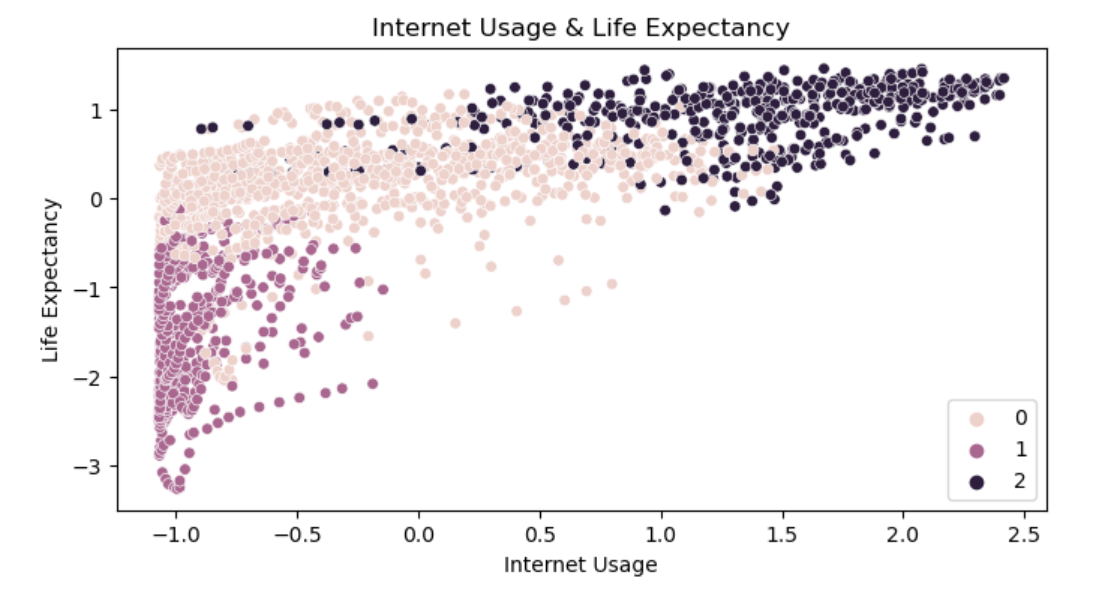
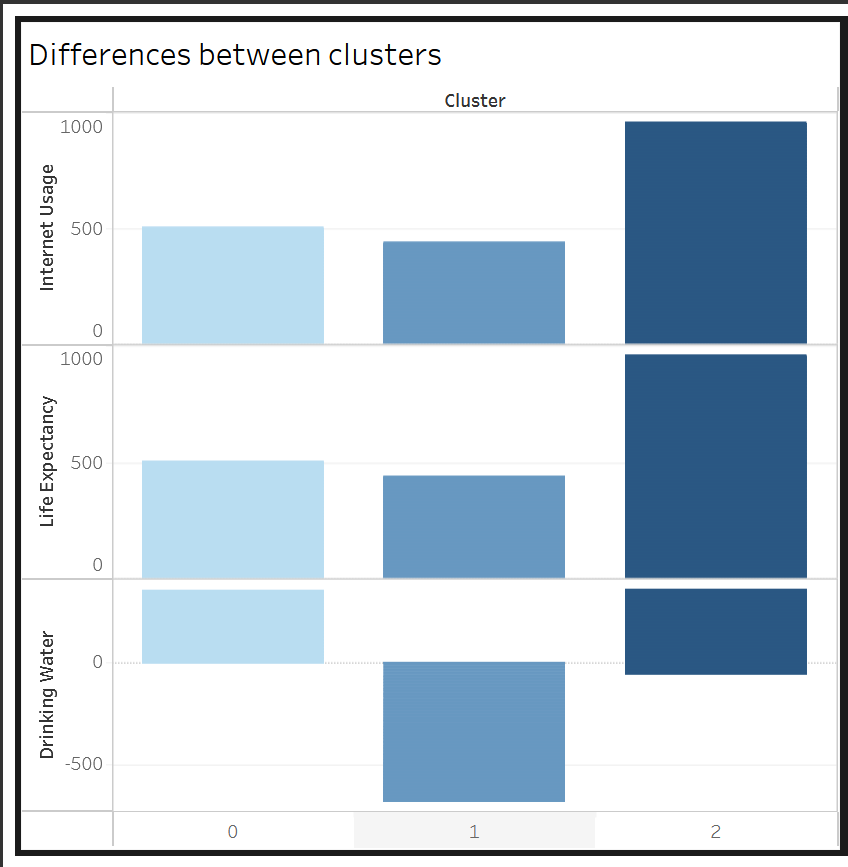
Step 4: Clustering
I used machine learning algorithms to perform clustering on the data. Based on scores assigned to each clustering model I chose 3 clusters which far better described the relationship between internet usage and life expectancy.
Conclusion
At low levels of internet usage, like in Africa during the early 2000’s there was practically no correlation between life expectancy and internet usage. From the mid-2000's however there began to be an increasingly stronger relationship between the two variables. In other regions of the world there were very strong positive correlations between life expectancy and internet usage.
The conclusion was definite and clear: Higher % of internet usage was in fact linked to higher life expectancies, especially in Asia, Europe and Oceania. A precursor was access to basic drinking water services.
Reflections
With this project, the most difficult part was the cleaning process. It was painful having to eliminate so many years from the dataset, simply because the data was missing for so many countries for many of the early years. I was reminded, that as an analyst I will often have to make such difficult choices for the sake of having a complete and meaningful analysis - No matter how hard I wish, data will always be missing.
The Way Forward
Although I was now able to show that one could in fact use levels of internet usage to predict life expectancy, it would be interesting to see by which means this occurs. Is it that access to the internet helps disseminate knowledge of foods and practices that are unhealthy and thus leads citizens to adopting healthier practices? This is a question that would be interesting to answer. A multiple regression would probably even more interesting results. This is something I have planned for the near future.
Download Project FolderPlaceholder text by Mnguni Zulu. Photographs by Mnguni Zulu.